Personal overview
The personal overview at/overview is the primary landing surface.
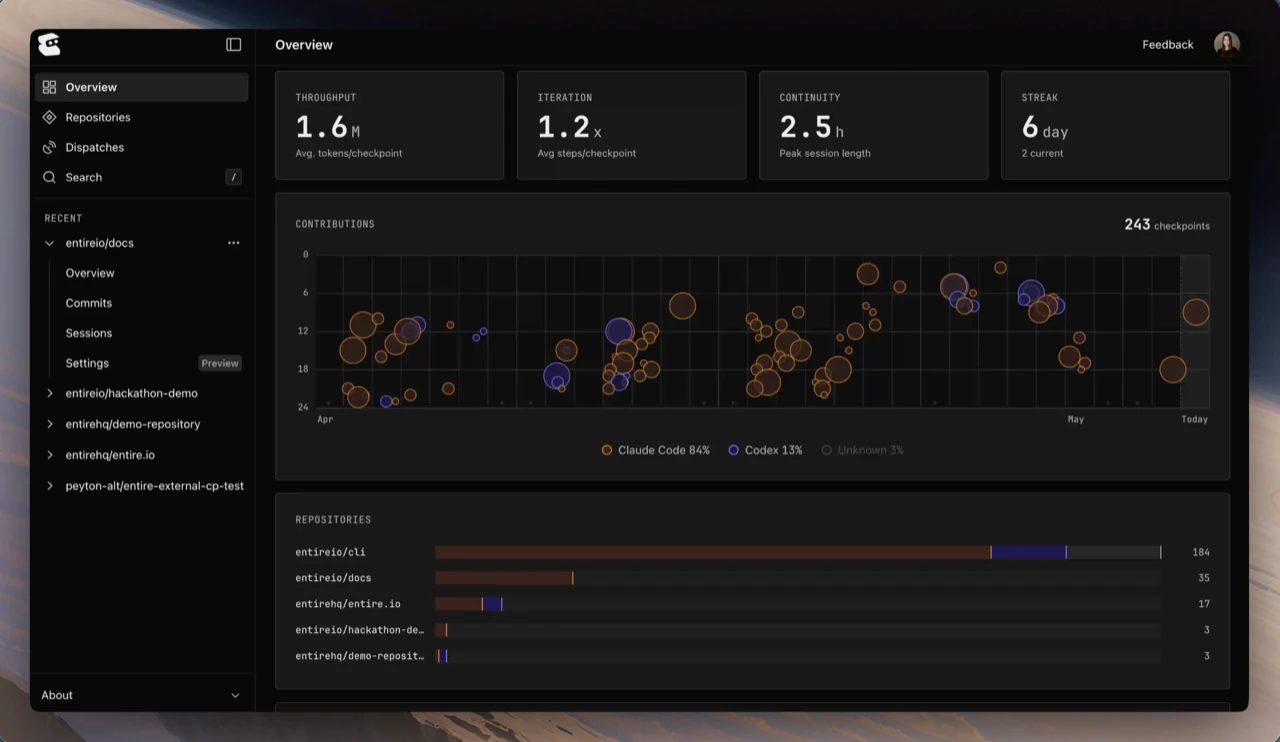
- Stats grid — throughput, iteration, continuity, and streak across all your sessions
- Contributions chart — recent checkpoints over time, with agent attribution (Claude Code, Codex, and others)
- Repositories breakdown — activity per connected repository, with a bar showing relative checkpoint volume
- Recent commits — your most recent commits across all connected repositories
Where to click first
If you’re new to entire.io:- Glance at your stats grid to see how much activity has been captured
- Open the most recently updated repository in the list
- Click any checkpoint to start a Review a Checkpoint flow
Continue with
Review a Checkpoint
Open a checkpoint and see what changed.
Inspect a Session
Read the transcript and tool calls behind a checkpoint.